Social media now reaches 5.79 billion people, roughly two-thirds of everyone on the planet. The opportunity is obvious. The harder part is knowing which of these numbers actually hold up when you build a plan around them.
After fifteen years advising clients as a Fractional CMO and teaching social media at Rutgers Business School, I have learned that a marketing decision is only as good as the data underneath it. Bad data wastes budget. Worse, it sends you confidently in the wrong direction. So every figure below is current and pulled from the original source, not a roundup.
These 25 social media marketing statistics answer the questions I actually get asked. How many people are on social? Which platforms matter? Where is the ad money going? And the big one for 2026: what happens to social media now that people are starting to ask AI instead of searching?
Key Takeaways
? Social media is now a global supermajority. 5.79 billion people use social platforms as of April 2026, roughly two-thirds of everyone on Earth, and the average user spends more than 18 hours a week on social and video.
? Reach is no longer the hard part. With YouTube, Facebook, TikTok, and Instagram each reaching close to or above 2 billion people, one or two well-chosen platforms already put the majority of your audience within range.
? Marketers have voted with their calendars. Instagram (70%) and Facebook (69.6%) lead marketer adoption, but TikTok is the platform the most marketers plan to invest in next.
? Social is becoming a search engine. 52% of users now prefer searching social platforms over AI chatbots for real opinions, while nearly a third of marketers report losing search traffic to AI tools.
? Responsiveness is a revenue issue. 73% of consumers say they will buy from a competitor if a brand ignores them on social, which makes service as much a growth lever as advertising.
How Many People Use Social Media in 2026?
As of April 2026, 5.79 billion people use social media, which works out to about two in three people on the planet. That number grew by 294 million in a single year. The average user now spends roughly 18 hours and 36 minutes a week on social platforms and online video, spread across 6.5 different networks each month.
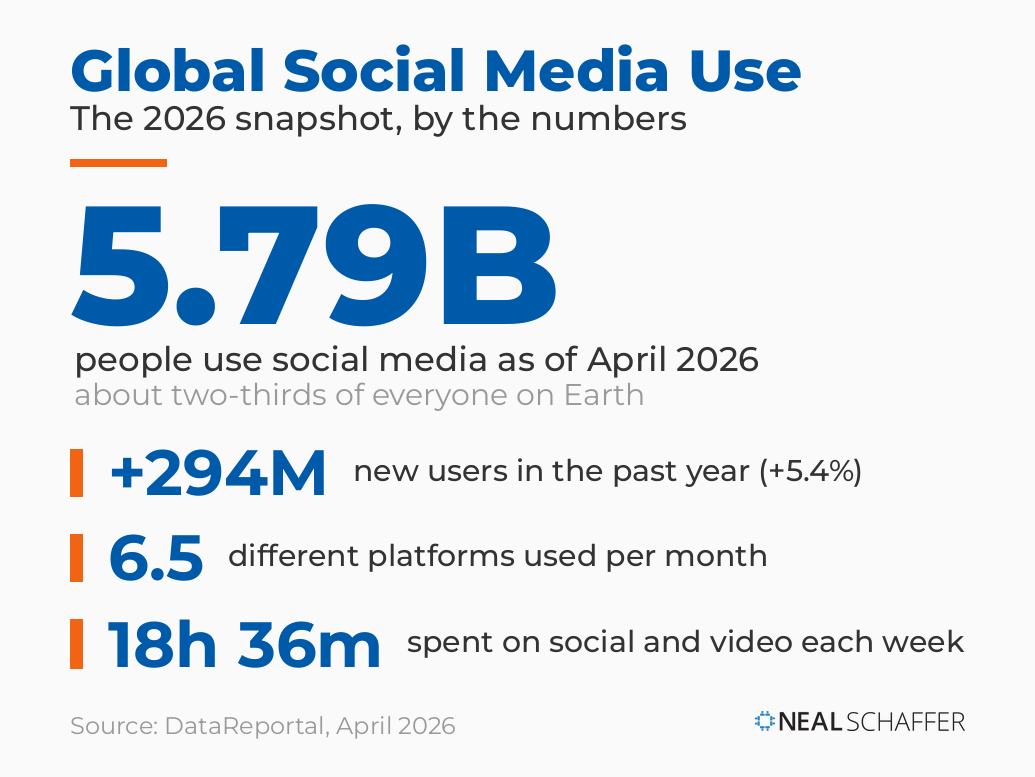 Social media now reaches 5.79 billion people, about two-thirds of the planet, and the typical user spends more than 18 hours a week across 6.5 different platforms.
Those headline figures come from DataReportal’s April 2026 analysis, and they reframe what “being on social” even means. The growth is coming from depth rather than new signups. People already on social are using more apps and spending more time on them, which is why a single channel rarely tells the whole story anymore. This is the same fragmentation I write about in Digital Threads, where the point is that your customer does not live on one platform, so neither can your message.
- 5.79 billion people use social media as of April 2026, about two-thirds of the global population, up 294 million year over year.
- The typical user spends around 18 hours and 36 minutes a week on social media and online video.
- The average person uses 6.5 different social platforms every month, which is why multi-channel coordination beats single-platform obsession.
And most brands read that 6.5 figure backwards. They treat it as pressure to be everywhere, when it is actually permission to be selective, because the audiences overlap heavily. If you understand where your specific customers spend their time, focusing on two or three platforms will outperform a thin presence on eight. That focus is the foundation of what social media marketing really involves.
Which Social Media Platforms Have the Most Users?
There is no single “biggest” platform, because it depends on what you measure. By advertising reach, the metric marketers care about most, YouTube leads, with ads reaching 2.65 billion people each month. Facebook follows at 2.39 billion, then TikTok at 2.21 billion and Instagram at 1.99 billion. LinkedIn rounds out the top five at 1.43 billion registered members.
That ranking, based on DataReportal’s reported ad-reach data, matters more than vanity user counts because it reflects the audience you can actually buy access to. The table below is the cleanest snapshot of where the people are in 2026.
| Platform | Reported monthly advertising reach (2026) |
|---|
| YouTube | 2.65 billion |
| Facebook | 2.39 billion |
| TikTok | 2.21 billion |
| Instagram | 1.99 billion |
| LinkedIn | 1.43 billion (registered members) |
- YouTube ads reach 2.65 billion users monthly, the largest social advertising audience in the world.
- Facebook reaches 2.39 billion through its ad tools, still the giant nobody should write off.
- TikTok reaches 2.21 billion, confirming it is no longer the upstart.
- Instagram reaches 1.99 billion and crossed a milestone in September 2025, hitting 3 billion monthly active users according to CNBC.
- Snapchat reached 477 million daily active users and 943 million monthly active users in its Q3 2025 results, a reminder that “smaller” platforms still command enormous, hard-to-reach Gen Z audiences.
If someone tells you Facebook is dead, run for the hills. The data says the opposite. What has changed is not Facebook’s size but its role in a wider mix, which is exactly why keeping an eye on social media trends beats reacting to whichever platform is having a news cycle.
Who Uses Social Media in the United States?
In the United States, YouTube and Facebook remain the most widely used platforms by a wide margin. According to the Pew Research Center’s 2025 survey of U.S. adults, 84% use YouTube and 71% use Facebook. Instagram is the only other platform a majority touches, at 50%. TikTok sits at 37% and WhatsApp at 32%.
These are the numbers to anchor a U.S. audience plan, because they describe actual reach across the whole adult population, not just the loudest users. Age changes the picture dramatically, though, which is the detail too many brands skip.
| Platform | Share of U.S. adults who use it |
|---|
| YouTube | 84% |
| Facebook | 71% |
| Instagram | 50% |
| TikTok | 37% |
| WhatsApp | 32% |
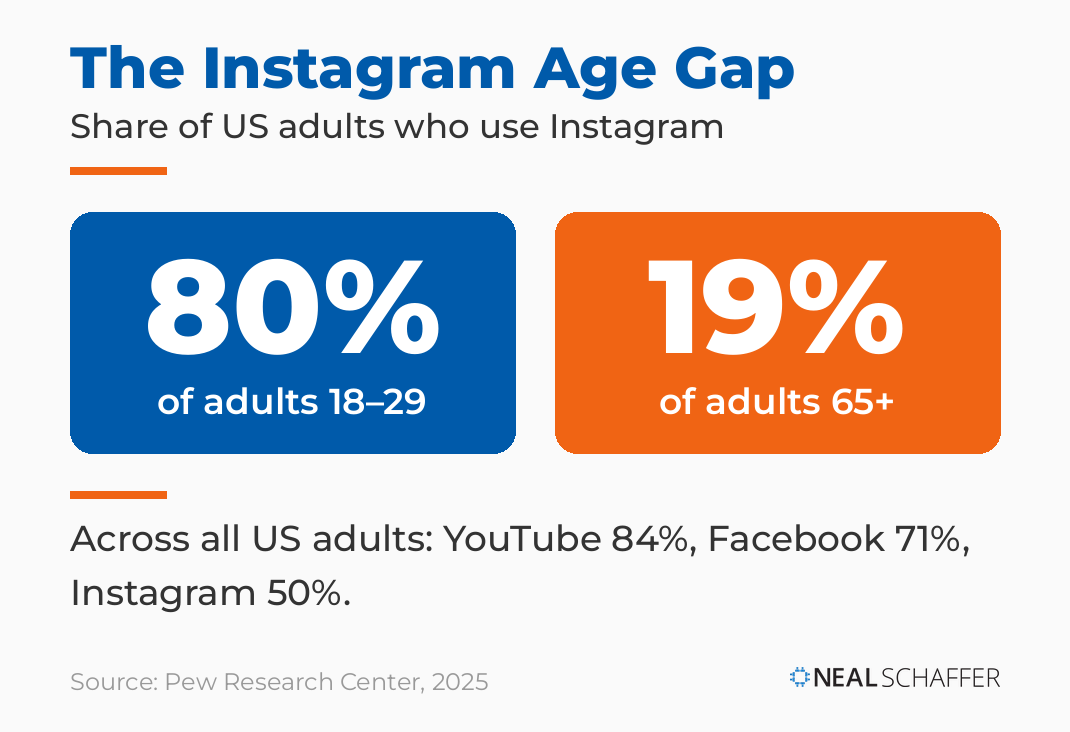 The widest generational split in US social media use is on Instagram: 80% of adults aged 18 to 29 use it, versus just 19% of those 65 and older.
- 84% of U.S. adults use YouTube, making it the most universal platform in the country.
- 71% use Facebook, which still reaches more Americans than any platform except YouTube.
- 50% use Instagram, the only other platform above the halfway mark.
- 37% use TikTok and 32% use WhatsApp, both smaller overall but heavily skewed by age and community.
- 80% of adults aged 18 to 29 use Instagram, compared with just 19% of those 65 and older, per Pew’s age-group data, one of the widest generational gaps in all of social media.
That 61-point gap is the whole ballgame for targeting. A brand selling to retirees and a brand selling to college students are operating on different platforms even when they say “we do social media.” Before you assume your audience is somewhere, confirm it with a proper social media audit of where they actually are.
How Are Marketers Using Social Media in 2026?
Marketers have largely settled on their core platforms, but momentum is shifting. Instagram is now the most-used platform among marketers at 70%, with Facebook close behind at 69.6%. TikTok adoption sits at 57%, yet it is the single platform the most marketers plan to invest in for 2026, according to HubSpot’s State of Marketing Report.
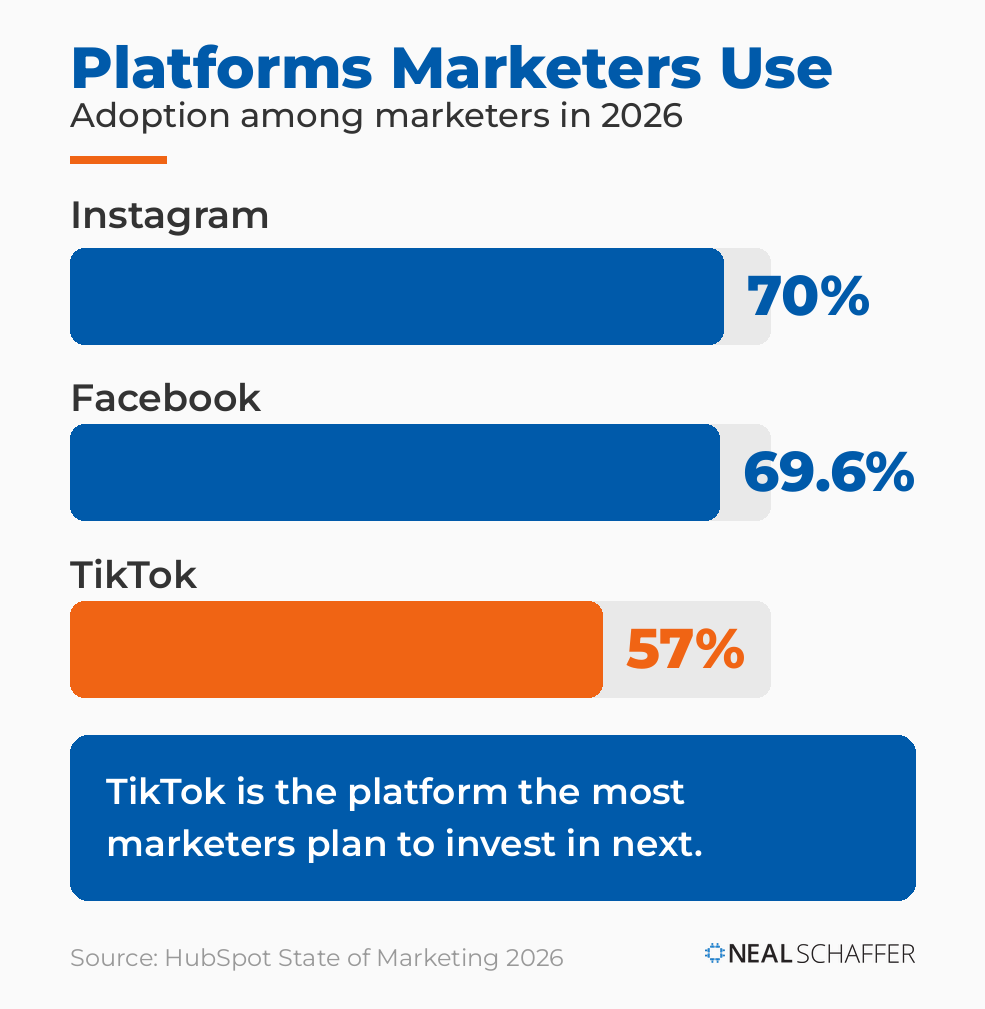 Instagram and Facebook are the platforms marketers use most, at roughly 70% each, but TikTok is the one the largest share of marketers plan to invest in next.
That gap between current use and future intent is the tell. Marketers are not abandoning the giants. They are adding short-form video weight where attention is growing fastest.
- 70% of marketers use Instagram, making it the most popular platform in their toolkit.
- 69.6% use Facebook, essentially tied with Instagram for day-to-day use.
- 57% use TikTok, and it is the platform the most marketers plan to lean into next.
- Paid social is one of the highest-ROI channels marketers report, second only to their own website, blog, and SEO.
Most brands stumble right here. They chase the platform that is trending instead of the one that converts for their specific business. The fix is unglamorous: track your own results. Knowing your real engagement rate and watching the right social media analytics tools will tell you more than any industry average ever can. On an episode of my podcast Your Digital Marketing Coach, I made the case for exactly this, arguing that “the more we know, the more informed our decisions can be, the more things become predictable, the bigger impact we can have with the same marketing budget.” Statistics like these are the starting point. Your own first-party data is the finish line.
Trying to Keep Up with Digital Marketing?
Just released: my new book to help small businesses, entrepreneurs, and marketers master digital marketing in today’s digital-first world.
Drawing on my Fractional CMO experience, Digital Threads simplifies complex strategies into clear, actionable steps for success.
Transform your business today—grab your copy! Click the cover or button below to buy on Amazon.
How Much Are Businesses Spending on Social Media Advertising?
Social media advertising spend is projected to reach 317.33 billion dollars worldwide in 2026, according to Statista’s advertising outlook. That is roughly three of every ten dollars spent on digital advertising, and it keeps climbing year over year as more of that budget moves to mobile.
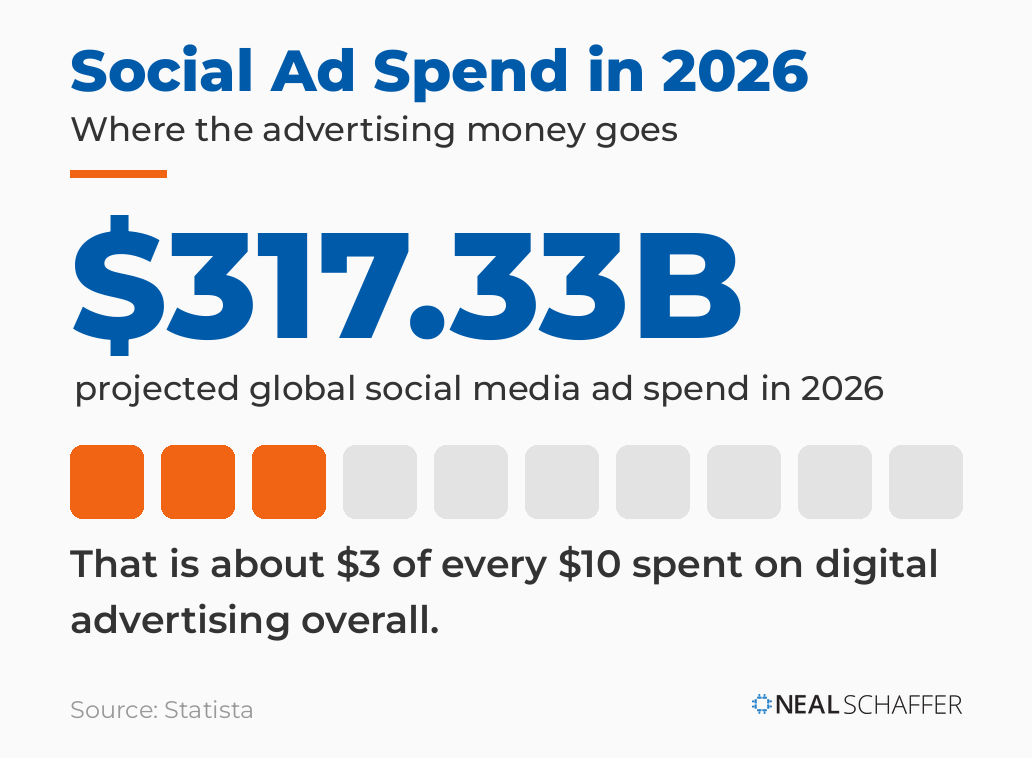 Global social media ad spend is projected to reach $317.33 billion in 2026, roughly three of every ten dollars that go into digital advertising.
The number is staggering, but the lesson is not “spend more.” It is “spend with data.” A bigger budget poured into the wrong platform just loses money faster.
- Global social media ad spend is projected at $317.33 billion in 2026, around a third of all digital ad spend.
I learned this the hard way getting access to Amazon’s ad platform for my own books. The temptation is to spread a tiny daily budget thin and hope. The smarter move is to spend aggressively enough to gather real data fast, then cut what does not work. Early on, paid social is most useful as a data-acquisition tool rather than a pure sales channel. It tells you which audiences, creative, and channels deserve more before you commit serious money. That principle applies whether you are a global brand or doing social media marketing for a small business on a shoestring.
What Do the Numbers Say About Video?
Video is the default format now. 91% of businesses use video as a marketing tool in 2026, and 84% of consumers say they want to see more video from the brands they follow, according to Wyzowl’s 2026 video marketing survey. Short-form video in particular dominates both attention and reported ROI.
That consumer demand number is the one to sit with. People are actively asking brands for more video. The brands that ignore that are leaving the most-wanted content type on the table.
- 91% of businesses now use video as a marketing tool, back to an all-time high.
- 84% of consumers want to see more video content from brands, a preference that has held steady for years.
The catch is volume. Wanting to make more video and actually staying on cadence are different problems, and the second one is where most teams break down. Picking your best times to post on social media helps, but the real fix is a repeatable system rather than heroic bursts followed by silence.
Is Social Media Replacing Search Engines?
This shift will define 2026, and it cuts two ways. 52% of users now prefer searching social platforms over AI chatbots when they want real opinions, according to Sprout Social. At the same time, 92% of marketers are optimizing for AI-powered search, and nearly 30% report losing search traffic to AI tools, per HubSpot.
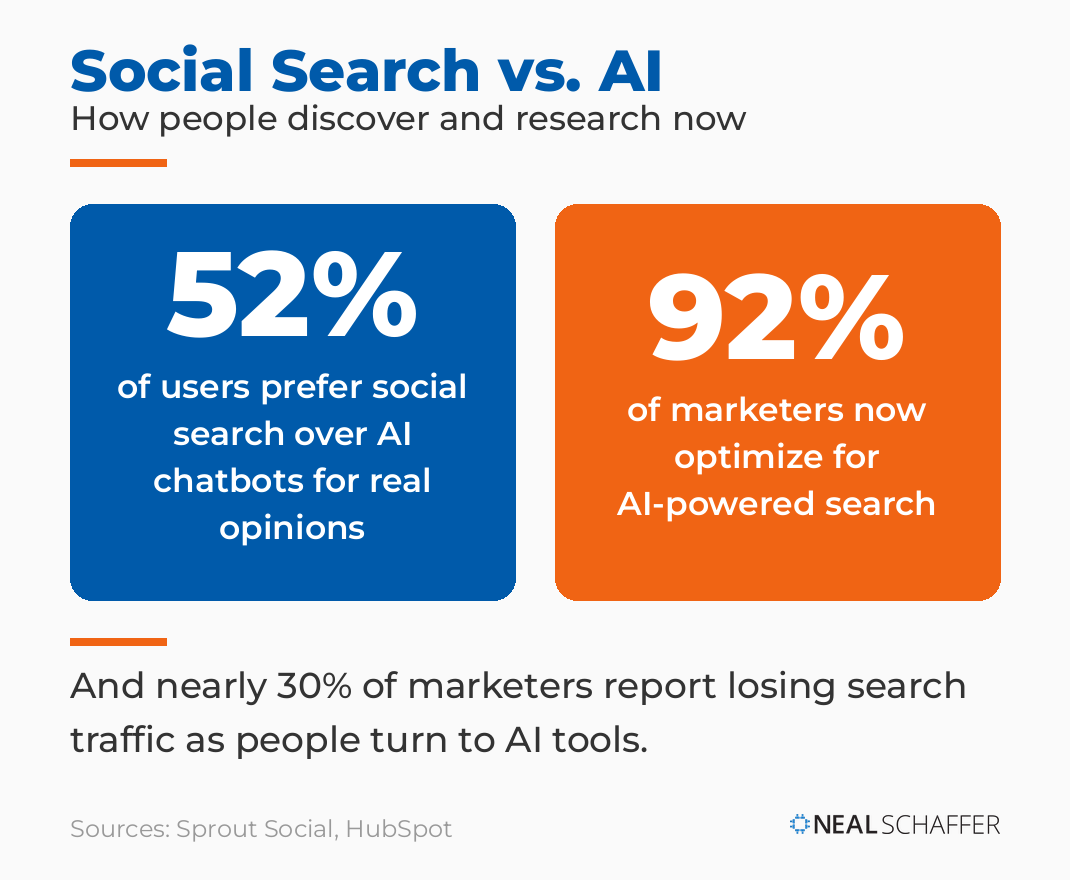 Most people still prefer social search over AI chatbots for genuine opinions, even as 92% of marketers optimize for AI-powered search and nearly a third report losing traffic to it.
Both things are true at once. People are routing around traditional Google search, and they are splitting between two destinations: social platforms for human experiences, and AI assistants for quick answers.
- 52% of users prefer social search over AI chatbots when they want authentic, human perspectives.
- 92% of marketers are optimizing for AI-powered search engines, alongside traditional ones.
- Nearly 30% of marketers report losing search traffic as consumers shift to AI tools for answers.
Why does this matter for your social media strategy? Because social content is now doing double duty. It satisfies the people who search inside TikTok and Instagram, and well-structured social and blog content increasingly feeds the AI assistants that people ask instead of Google. The brands that win are not picking one. They are showing up as a real, human voice in both places. Listening to those conversations through social listening is how you find out what your audience is actually asking before you try to answer it.
How Does Social Media Influence Buying Decisions?
Social media now sits in the middle of the purchase journey, not at the edge. The most actionable stat here: 73% of consumers say they will buy from a competitor if a brand fails to respond to them on social, according to Sprout Social. Responsiveness is not a nicety. It is a revenue lever.
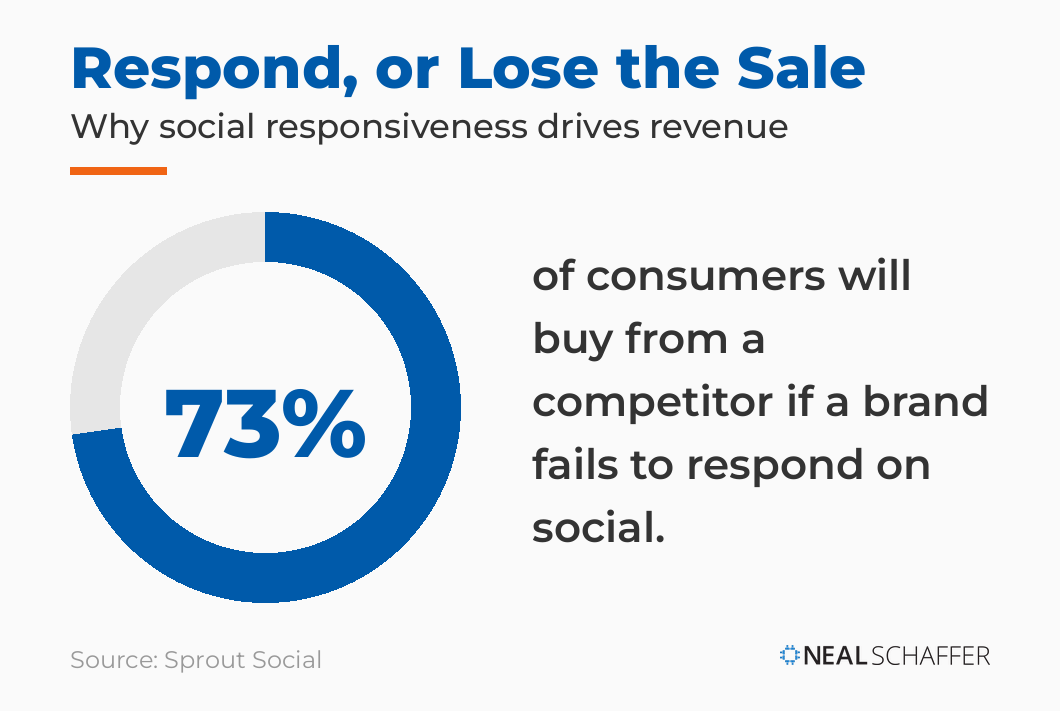 Responsiveness is a revenue issue: 73% of consumers say they will buy from a competitor if a brand fails to respond to them on social.
That reframes what social media is for. It works as a two-way channel where silence actively costs you sales, and where showing up as a human earns trust that advertising cannot buy.
- 73% of consumers will switch to a competitor if a brand does not respond to them on social.
- 85% of marketers consider influencer marketing an effective channel, per Influencer Marketing Hub’s 2026 research, as creators become a primary way consumers discover and vet products.
The old “post and pray” playbook misses this entirely. The brands earning recommendations and repeat business are the ones actually in the conversation, answering questions, and treating their feed like a relationship. If you are not sure whether yours is doing that, a quick look at what you publish through the lens of social media management usually reveals the gaps fast.
Putting These Social Media Marketing Statistics in Context
A few honest caveats, because data deserves them. Platform reach and user figures are not all measured the same way, so comparing them directly is rough. LinkedIn’s 1.43 billion, for example, counts registered members rather than active monthly users. Global averages also hide enormous regional and generational variation, as that 80% versus 19% Instagram gap by age shows.
Two more things worth keeping in mind. Self-reported usage and logged app usage often disagree, which is why the same platform can rank differently from one data source to the next. And the fastest-growing behavior now is depth rather than headcount: people spend more time and use more platforms even where new-user growth has flattened, so competition for attention keeps rising. AI-driven discovery is still early and volatile, too, so expect the social-versus-search numbers to keep moving through the rest of 2026.
The point of these 25 numbers is not to memorize them. It is to make better decisions than the marketer who is guessing. Build your plan on data, then keep measuring it with the right social media analytics, and you will be ahead of most of your competition by default. No benchmark on this page knows your customers the way your own analytics do.
Social Media Marketing Statistics FAQ
About 5.79 billion people use social media as of April 2026, roughly two-thirds of the global population, based on DataReportal’s analysis. The figure rose by 294 million in the past year, a 5.4% increase, though DataReportal counts user “identities” rather than unique individuals, since many people maintain accounts on several platforms.
It depends on the metric. By advertising reach, YouTube leads at about 2.65 billion, followed by Facebook at 2.39 billion. By U.S. adult usage, YouTube (84%) and Facebook (71%) are far ahead of everything else, per Pew Research Center.
Start with where your specific audience already spends time, not with whichever platform is trending. Because audience overlap is high and the average user is on 6.5 platforms, a focused presence on two or three channels usually outperforms a thin presence on many. Your own analytics should drive that choice.
Yes, and arguably more than before. With 52% of users preferring social search over AI chatbots for authentic experiences, social platforms remain a primary discovery channel. Strong social content also increasingly feeds the AI assistants people now ask, so it works in both worlds.
Global social media ad spend is projected to reach roughly $317.33 billion in 2026, according to Statista, which is about three of every ten dollars spent on digital advertising overall.
Turn These Statistics Into a Strategy That Works
Numbers like these are only useful if they change what you do on Monday morning. The throughline across all 25 is simple: audiences are fragmented, attention is the scarce resource, and the brands that win treat social as a data-driven, two-way relationship rather than a broadcast.
If you want to turn these stats into an actual plan, the next step is building a coordinated approach across your channels instead of optimizing each one in isolation. My breakdown of how to build a social media strategy walks through how the pieces fit together. For the full cross-channel playbook, grab a free preview of Digital Threads. And if you would rather have an outside expert help build and run that strategy alongside the rest of your marketing, my Fractional CMO services might be the right fit.
Actionable advice for your digital / content / influencer / social media marketing.
Join 13,000+ smart professionals who subscribe to my regular updates.