Tuesday, March 28, 2023
Analysis paralysis – the idea that when faced with too many choices consumers will choose nothing – is it real? When does it kick-in? How does it impact email marketing?
These are the questions we sought to answer as we did a series of tests for a client on the optimal number of products to include in an email message. The case study is below – as with all the testing I do I encourage you to test with your own audiences, rather than just apply what we learned from the case study.
To the right you’ll see a sample product block wireframe (note the green background, same as in the control/test image below) from this email.
You’ll see that it includes a large product image, the product name, and two calls-to-action. Since these email messages featured apparel, one call-to-action was a text link to “Men’s sizes” – and the second was a text link to “Women’s sizes.”
In this case study, as in many of my case studies, our starting point was an email from the previous year’s campaign that performed pretty well. The original, aka our control, had a total of four product blocks.
We decided to test more product blocks (6, to be exact). This was done relatively early in the campaign, to give us learnings we could use every time we use this template. See wireframes for both versions below.
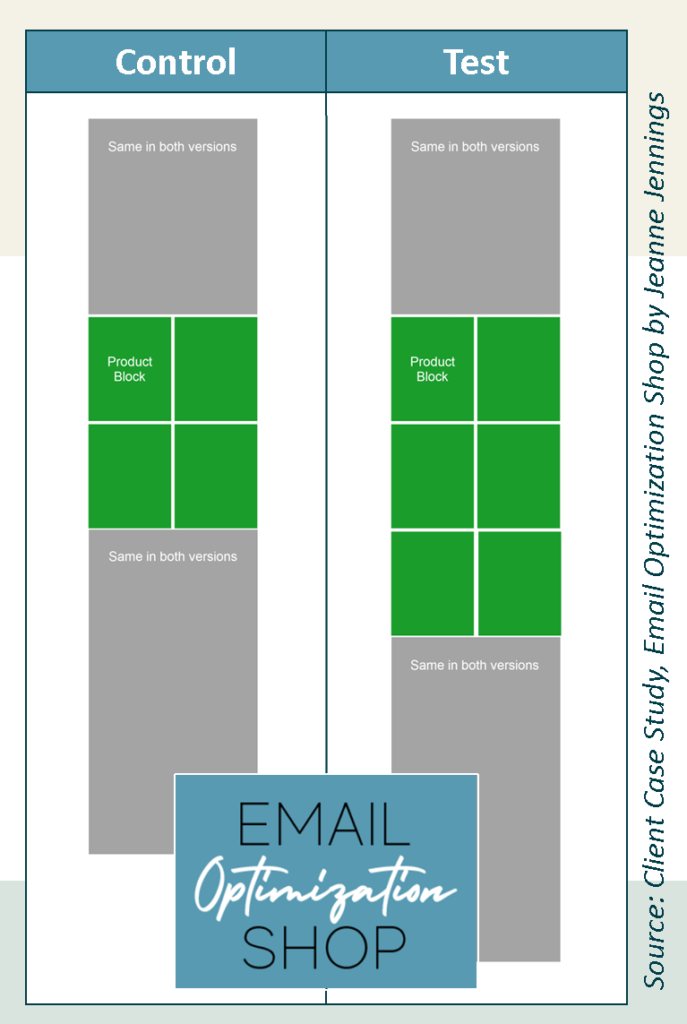
The control had 4 product blocks. For the test, as you can see in the image above, we added 2 more product blocks so there were a total of 6.
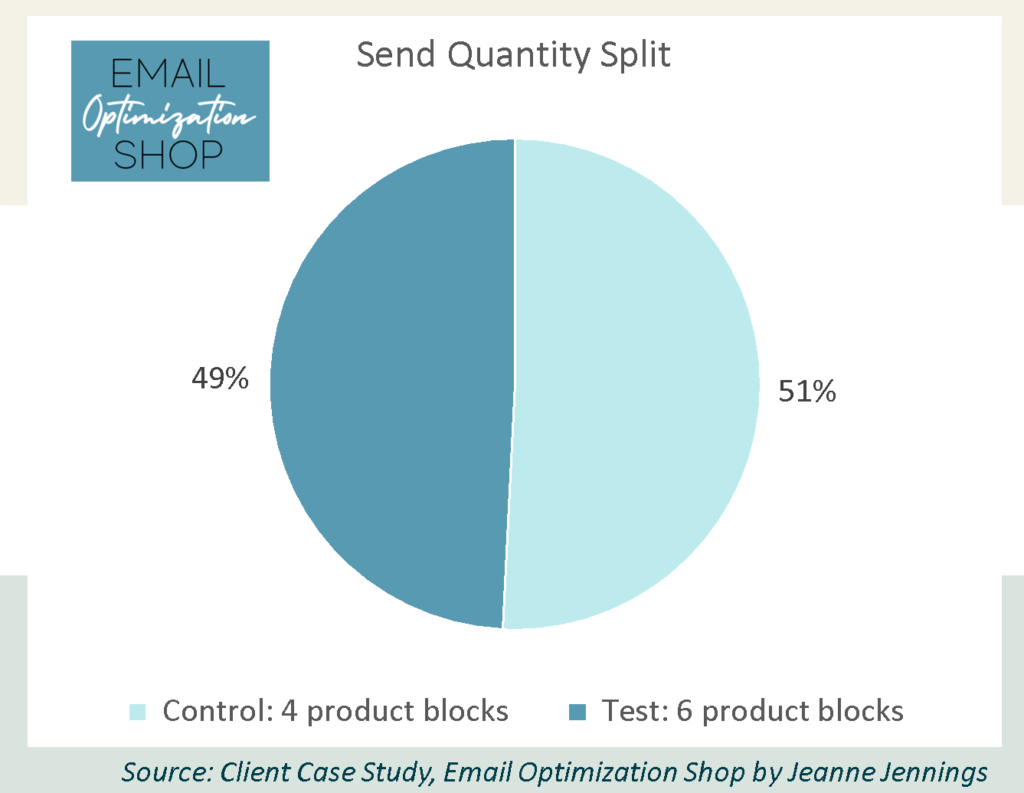
We had a send quantity of more than 300,000, which we divided into two segments. The large sample sizes will help us gain statistically significant results.
So which version won? Take a minute and consider which you believe worked better. I’ll give you some dots which you can scroll through to get the results when you have your best guess.

Here are the results.
So, which version won?
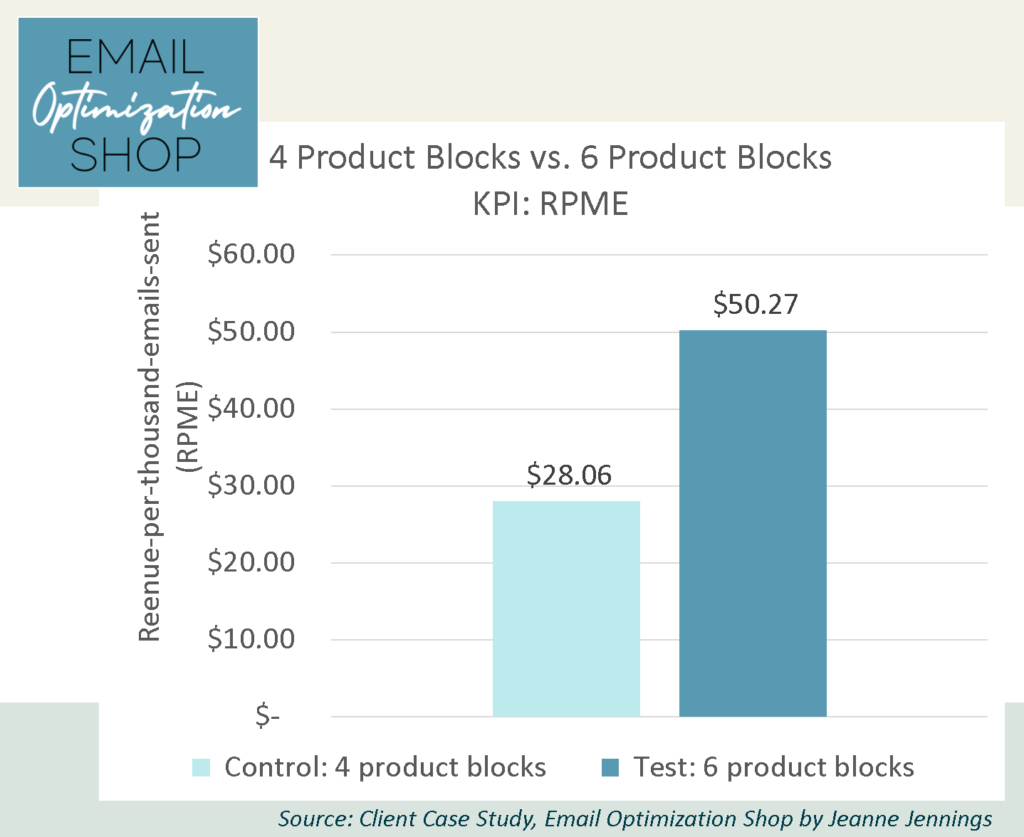
The test, with 6 product blocks, delivered a higher revenue-per-email (RPME), our KPI, than the control. The lift on RPME was just 79%, which was definitively statistically significant.
Here are some more detailed results, which will tell us not only which version won, but why it won.
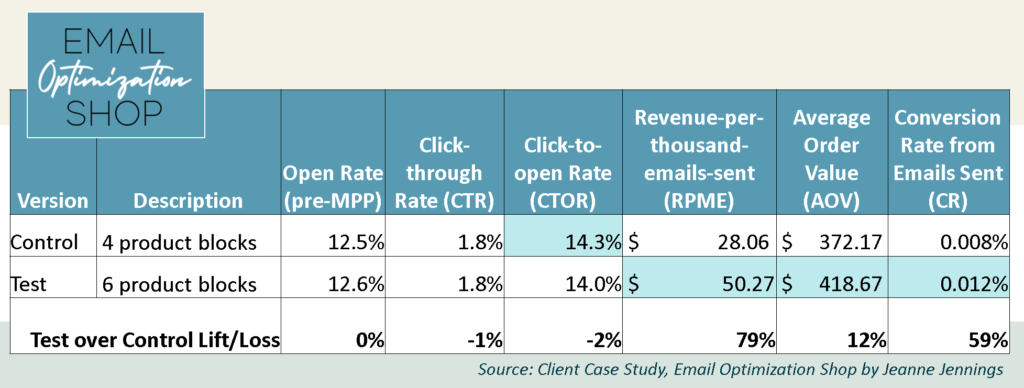
So why did the test, with 6 product blocks, outperform the control? The key reason is conversion rate from sent (CR). As you can see, the test had a CR 59% higher than the control – 0.012% vs. 0.008%.
Also helping the test beat the control – the average order value (AOV). For the test it was over $418, while the control’s AOV was just over $372. That’s a 12% lift for the test.
The diagnostic metrics (open rate, click-through rate, and click-to-open rate) are all nearly equal.
If you’re not testing how many products to include in your email messages now’s the time! Give this a try with your next email campaign and let me know how it goes!
Feeling overwhelmed? Let’s talk about how I can help you improve the bottom-line performance of your email with strategies and tactics like this one.
Be safe, stay well,