Thursday, September 21, 2017
Greetings! My name is
Jennifer Lyons, MSW from Lyons Visualization, LLC. I am a social worker, data designer, and speaker. In my independent consulting business, I bring creative energy to making data intriguing and impactful, while helping clients transform the way they communicate their story. Today I want to talk about a method I like to use that is effective in both engaging clients in the interpretation of data, while also setting the stage for an impactful visual summary of findings.
In this post, I am going to focus on a process to use after data is collected and analyzed. After analysis, it is time to dive in and highlight the story within the data. Part of storytelling with data is making meaning of the information in context. Our clients are the experts on the delivery of their programs, people they work with, and the reporting context. It is important to include our clients in thoughtful interpretation of their data. In this post, I am going to focus on using a worksheet to guide a data interpretation meeting and transform findings into a visual summary.
Hot tip: Start by designing the data interpretation worksheet. This worksheet is the backbone to a visual executive summary of your findings. Below is an example of a simple data interpretation worksheet made for an evaluation of an after-school reading program. Included are graphic displays of the data with blank boxes that give space for clients to add their interpterion. During the data interpretation meeting, you can use this worksheet to partner with clients to highlight and frame central findings in the data.
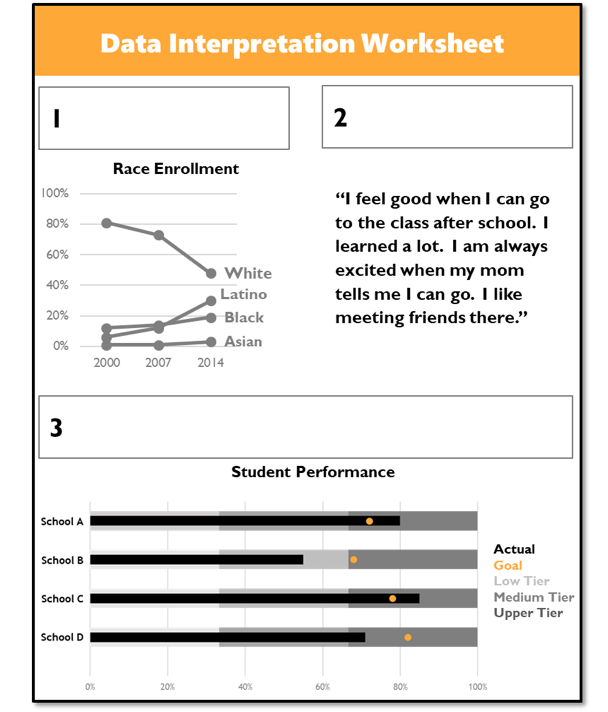 Hot Tip: Paste each graph from the worksheet on an empty slide and ask your clients to examine each data point.
 Prompt them with questions about what they see as positive, negative, and surprising about the findings. It is also important to ask your clients to think of relevant context. As a group, process everyone’s recommendations and thoughts. There are often a lot of important things being shown in one graph, but together, you can decide on what is most important. Then, write the most important takeaway/s from the graph in the graph title. This process is repeated for each graph. By the end, you will have something like this:
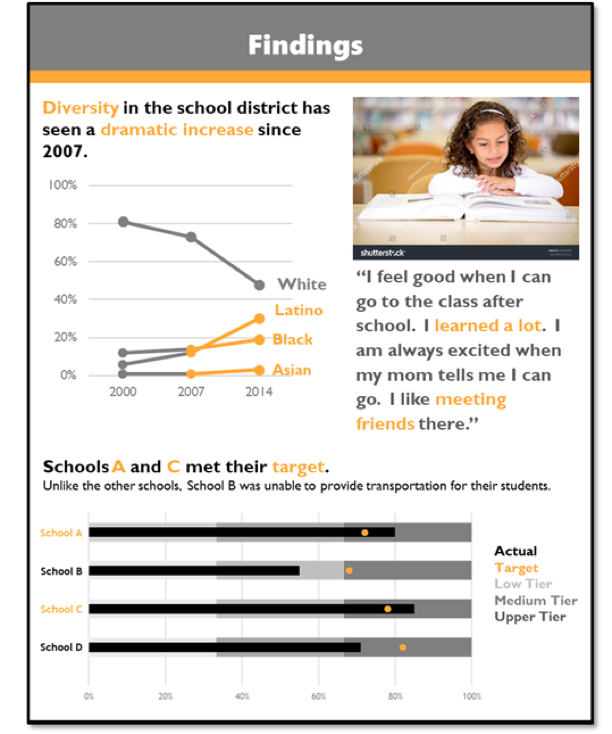 Hot Tip: This completed worksheet can easily be transformed into a visual summary of your findings.
 For this worksheet to transition to a visual executive summary, there are key aspects missing. Add effective titles from the worksheet, use color to showcase your story, and add an engaging visual.
Ta-da! You have a nice visual report based on thoughtful data interpretation using your client’s feedback and expertise. My hope is that by reading this post, you are more inspired to think of new ways to engage your client in the data and visually display findings.
The American Evaluation Association is celebrating SW TIG Week with our colleagues in the Social Work Topical Interest Group. The contributions all this week to aea365 come from our SW TIG members. Do you have questions, concerns, kudos, or content to extend this aea365 contribution? Please add them in the comments section for this post on the aea365 webpage so that we may enrich our community of practice. Would you like to submit an aea365 Tip? Please send a note of interest to aea365@eval.org. aea365 is sponsored by the American Evaluation Association and provides a Tip-a-Day by and for evaluators.