Tuesday, March 22, 2022
One of the things I love most about email marketing is all the data. It’s so trackable; you can see how recipients are engaging with your messages at each step of the email marketing funnel.
Here’s the thing; there’s so much data that it’s easy to get lost in it. It’s rare that my clients don’t have access to the data they need to analyze and optimize their email marketing efforts. Often the challenge they face is finding the data they need; there’s so much that they can get lost in it.
That’s when I do a marketing funnel analysis – see an example below.
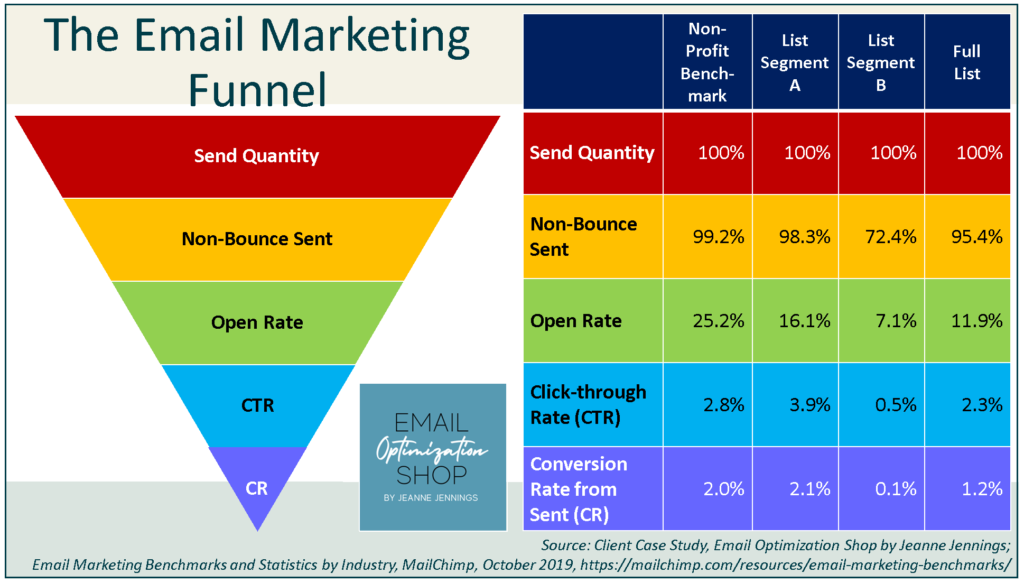
At the left you’ll see the email marketing funnel; it tracks the path from the send (at the top) through to the conversion (at the bottom). This is a basic funnel; the metrics we’re looking at are:
To the right you see a table. The rows (and the colors) correspond to the different levels of the funnel – see the metrics there in the first column?
The next three columns are providing quantitative values for comparison; in this case they are:
- A relevant industry benchmark (this client was a not-for-profit organization)
- Data on two key segments of the client’s list (labeled “A” and “B” here)
- Metrics for the client’s full list (labeled “Full List” at the far right)
Once again, this is a pretty simple execution; you can be much more detailed, adding more columns and looking at many different segments of a list, or even use the metrics from different individual sends. It’s very versatile. You could also include internal benchmarks in addition to or instead of the industry benchmarks.
So, when you look at the data this way what do you see?
Here’s what I see.
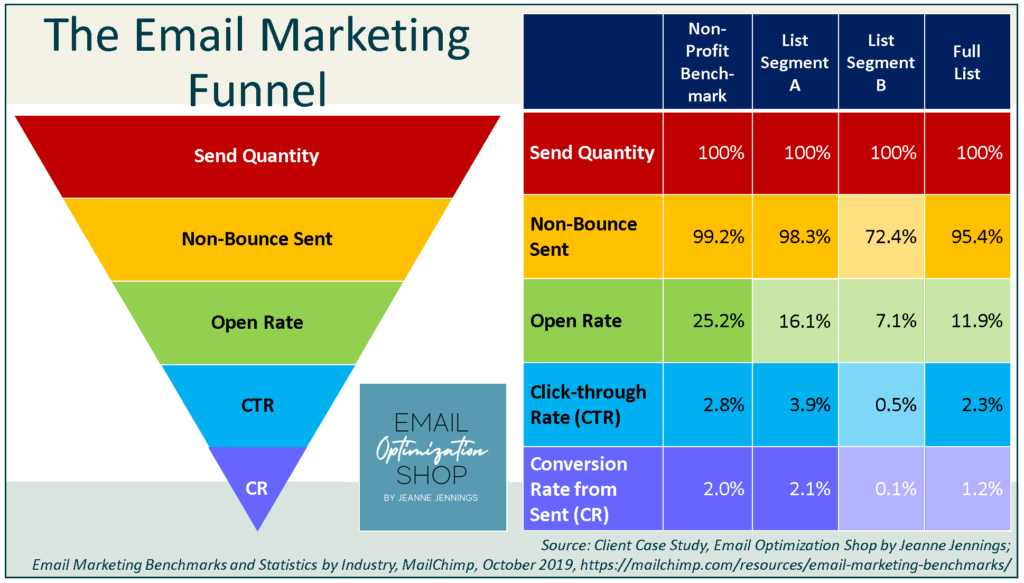
I start by identifying metrics where the client’s list or list segments are dramatically underperforming the industry benchmark. In the illustration above, I’ve shaded those areas, making them lighter to highlight them.
Side note: Industry benchmarks are not a sign of success or failure. Your metrics can fall short of industry benchmarks and you can still be successful at meeting your business goals. There are also times when you exceed industry benchmarks but fall short of your business goals.
What industry benchmarks are is a gauge of what’s possible. And if it’s possible, it’s worth shooting for. They can also help you identify areas of relative strength – and weakness in your email program.
Let’s start at the top, with send quantity. The send quantity is always going to be 100%, so no news there.
This is just the opposite of the bounce rate.
The Data
The next row has data on the non-bounce send quantity; this is basically emails which were sent and did not return a bounce messaging telling us they were not deliverable. Segment A and the full list have metrics that are a little below the industry benchmark, but not by much. But look at the non-bounce sent rate for list segment B. It’s 72%, which is roughly three-quarters of the industry benchmark of 99%. I’ve highlighted this, as there is good potential for improvement here, especially since the other client metrics are in line with the benchmark.
The Fix
How do you improve non-bounce sent? You look at the bounce messages being returned to see whether they are hard (permanently non-deliverable) or soft (temporarily non-deliverable); you might also see some that say your email is being blocked.
Then you’ll want to check to see if standard bounce management protocol is being followed, meaning that:
- Email addresses that return a hard bounce are automatically suppressed from future sends
- Email addresses that return soft bounces over the course of three consecutive sends are automatically suppressed from future sends
- Email addresses which return a bounce saying your email is being blocked are to be acted on; they usually include information on who to contact to discuss removing the block
When I say check, you need to do more than just ask if these policies are in place; you need to make sure they are being followed. I’ve seen some mishaps, like glitches where the automatic suppressions were set up but weren’t functioning properly.
There’s also an email service provider (ESP) out there (I’m not going to name them, I have made them aware of the issue) that has these parameters set up correctly, but they reset by default at the end of each calendar month. So, if you are sending fewer than three emails a month to a portion of your list (which is not uncommon with inactive segments), email addresses in this segment that soft bounce will never be automatically removed.
I stumbled on this while doing some bounce analysis a while back for a client. Once we found out there was a reset, we were able to identify and suppress those who had been soft bouncing for months as well as lengthen the timing of the reset to be six months (since no one on their list got fewer than three emails in a six-month period). But before we solved the puzzle their bounce rates were out of control.
But I digress. For the client in this case study, the issue was a simple misunderstanding. The ESP was identifying hard and soft bounces after every send and providing a bounce history for each email address. But they weren’t being automatically removed; the client needed to go in and manually remove them. This could be done in bulk and the platform made it easy to identify the bounced email addresses, so it wasn’t difficult nor was it time-consuming. The client just didn’t realize that this was their responsibility.
It’s also your responsibility to look at the bounce codes and messages and reach out to organizations that are blocking your email messages. While it would be nice to have your ESP handle this, most ESPs don’t have the staff and/or the bandwidth to do it. While your ESP can help you with your email deliverability, in the end it is your responsibility to take action to get your email to the inbox.
We’ve spoken so much about open rates lately! This data is from the before times – before iOS 15 was rolled out with Apple’s Mail Privacy Protection. That said, all the points made here are still relevant.
Apple’s Mail Privacy Protection
Apple’s Mail Privacy Protection (MPP) is having an impact on open rates, but for most email marketers it’s not as dramatic as expected. George Schlossnagle, SparkPost, recently wrote a data-driven post for the Only Influencers blog on the impact of MPP six months after iOS15 launched – it’s called ‘Are Opens Really Dead?’
I also weighed in earlier this year on MPP in my post ‘Apple’s Mail Privacy Protection: The Sky Isn’t Falling After All’ for this blog.
There’s always been a margin of error in open rates; emails that are read with images blocked won’t trigger an open, while you can scroll past an email in preview mode with image enabled and it will trigger an open, even if you didn’t look at it.
If you’re emailing the same list on an ongoing basis, then the margin of error on the open rate should be roughly the same from send to send. While MPP was rolling out, most marketers saw a small but steady increase in open rates from send-to-send. But open rates seem to be stabilizing with the wide adoption of iOS15, so things should be steady now.
My point: if you’re comparing pre-MPP open rates to post-MPP open rates, the comparison may not truly be apples-to-apples. But you should have a valid comparison if the open rates area all post-MPP.
The Data
Here you’ll see that both list segments, A and B (16.1% and 7.1%, respectively), as well as the full list (11.9%), are underperforming the industry benchmark (25.2%). They’re all shaded, since they are all a quarter to a half of the industry benchmark, suggesting that there is tremendous potential to do better here. The fact that they are all low suggests a global issue that needs to be addressed.
If you can improve your open rate, the metrics beneath it in the funnel should improve as well. This means that a higher open rate usually drives a higher CTR and a higher CR.
I say ‘usually’ because the quality of the opens matters. If the additional people opening and reading your email are as qualified or more qualified than the original openers, the later metrics should improve. But if they aren’t, then the later metrics won’t improve.
The Fix
There are a number of things that will impact your open rate, and I’ve written blog posts, usually based on client case studies, for most of them:
- Deliverability: if your email messages aren’t reaching the inbox, your open rate is likely to suffer. Improve your deliverability and your open rate should go up as well. Learn more
- Friendly From Line: If the recipients aren’t familiar with the name in your friendly from line, they are less likely to open your email. Use a brand or person’s name that your subscribers know, and your open rate should go up. Just make sure the friendly from line accurately represents the sender of the email to stay in compliance with anti-spam regulations. Learn more
- Subject Line: The first 25 characters of your subject line should tell the reader ‘what’s in it for them’ if they open this email. Be sure to put the most important part of your subject line at the beginning. Learn more
- Preheader Text or Snippets: No matter what you call it, this copy should support, not mimic, the subject line of your message. Make sure that your subject line and preheader text work together to show the value of opening the message. Learn more
- Preview Pane of Your Message: If your subscriber is scrolling through their inbox, you want the preview pane view of your email message to grab their attention and pull them in. With image blocking by default still prevalent in many email clients, the best way to do this is with headlines and other words, not with pictures, and not with headlines and words that are part of a picture. Learn more
One more note. Even if you’ve identified open rate as a problem and are doing A/B split testing to boost it as a way to boost the metrics beneath it on the funnel, don’t use open rate as your key performance indicator (KPI).
Increasing the open rate is a means to an end, not an end in itself. If you increase your open rate but the additional openers aren’t qualified prospects, your business metric (in this example, that’s conversion rate (CR), since it’s a non-monetary action the non-profit is goaled toward) won’t budge.
No matter what you are A/B split testing, your KPI should be something to do with what keep the lights on for your organization, which usually has to do with revenue or some type of conversion.
It’s important to know that the click-through rate is calculated by dividing the number of unique clicks by the non-bounce send quantity.
The Data
The client’s click-through rates (CTRs) look much better than their open rates did. The CTR for segment A is 3.9% which is actually above the industry benchmark of 2.8% (side note: imagine how this might improve if you get the open rate up!).
The full list CTR is 2.3%, below the industry benchmark but not terrible. But look at segment B’s CTR – 0.5%. this is not good, that’s why it’s shaded.
The Fix
Everything and anything in the body of your email message can impact your CTR. I’ve written about a lot of these causes and how to fix them, including:
- Image blocking: If you have a hero image at the top of your email and it doesn’t appear because images are blocked, it could negatively impact your CTR. Be sure you have some rich text copy up there, preferably a headline, which can be read even if images don’t appear, to engage recipients. Learn more
- Content: Think your copywriter is solely responsible for what the email says? Think again. If you aren’t including features/benefits/advantages, key selling propositions, and other foundational content in your email message it won’t be as persuasive as it could be. Learn more
- Calls to action: Do you have calls to action throughout the body of the message? My rule: I don’t want recipients to have to scroll to find one. These should be buttons at the top and bottom of your creative, and perhaps some text links in between (if it’s really long, you might add an additional button in the middle).
For a bottom-line conversion rate, you have to use the non-bounce send quantity in the denominator of the equation. It’s fine to look at micro-conversions (like the percentage of those who clicked that went on to convert) to understand where the weak points are in your program, but for overall performance conversion rate from sent will give you a big picture view of how your campaign did.
The Data
The client’s conversion rate from sent (CR) is about half what we’d expect – 1.2% for the full list versus the 2.0% benchmark.
Side note: this benchmark does not come from MailChimp, it’s from my experience. In offline direct mail 2.0% has traditionally been considered a good conversion rate. In email we often see lower conversion rates. But a big factor in conversion rate is what the conversion requires. This particular conversion requires little personal information (just an email address) and no financial data (no credit card information), so there’s very little friction, few obstacles to success. As a result, I estimated that a conversion rate of 2.0% is possible.
As you can see, although the full list conversion rate is below the benchmark, segment A’s CR was 2.1%, a slight lift over the benchmark. Once again, segment B is lagging – it’s CR is just 0.1%, which is why it’s shaded. This audience just isn’t interested in taking the action being asked of them. The low open rate and click-through rate also impact this.
The Fix
Everything and anything in the body of your email message can impact your CTR. I’ve written about a lot of these causes and how to fix them, including:
- Landing Page: Often a low conversion rate isn’t the fault of the email message – it’s that the landing page isn’t performing. In this case, the landing page is doing just fine with segment A; it’s segment B that has struggled to meet the benchmark throughout this funnel.
- Email-Landing Page Agreement: if your email doesn’t ‘tee up’ the client to take the action that the landing page requires for a conversion, that’s an issue. A common mistake here is having a ‘learn more’ button take someone to the start of the purchase process. Better to have two calls-to-action, one to ‘learn more’ and one to ‘buy now’ and then send your recipients to the landing page that corresponds to the button they clicked on.
- Audience: Segment B has struggled throughout this funnel analysis. It’s clear that while the program in place is working pretty well for segment A (minor tweaks will bring it up to benchmark), it’s not working at all for segment B. So, it’s time to either (a) try a completely different approach, or (b) stop mailing this list. In this case, after deeper analysis, the recommendation for this client was the latter.
So that was fun! What was intended to be a quick little walk -through of a funnel analysis turned into a 2,500+ word opus on how to optimize your email program starting with the metrics. Give this a try with your own next email campaign and let me know how it goes!
Be safe, stay well, peace,
jj