Wednesday, February 24, 2016
By: Matt Dickens, APTA Policy Analyst
Most public transportation service in the U.S. is provided by public agencies. Many public agencies contract all or parts of their services to private sector operators, in just one of the ways public transportation industry dollars flow to the private sector. Data from the FTA’s National Transit Database (NTD) lets us take a look at the patterns of what kinds of agencies contract service and how much service is contracted.
We can look at the scope of contracting in the public transit industry in a few ways, but here we will examine the amount of public transportation service, in vehicle revenue hours, that is contracted compared to that which is directly operated. The NTD describes public transit service as either Directly Operated by the agency or Purchased Transportation, i.e., contracted.
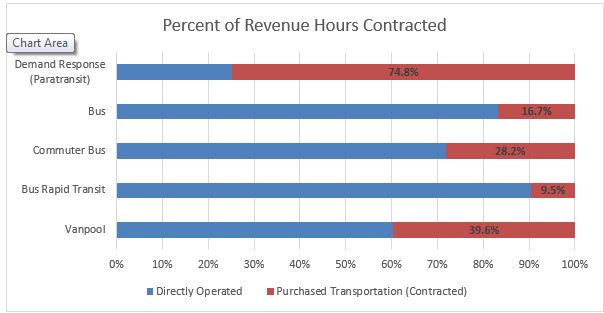
The total amount of service that is contracted varies by mode. Nearly three quarters of Demand Response service hours are operated by contract. By contrast, only 17% of fixed-route bus service hours are contracted – many more of these are operated by the agencies themselves. More vanpool service hours are contracted than bus service hours, but the majority are still directly operated.
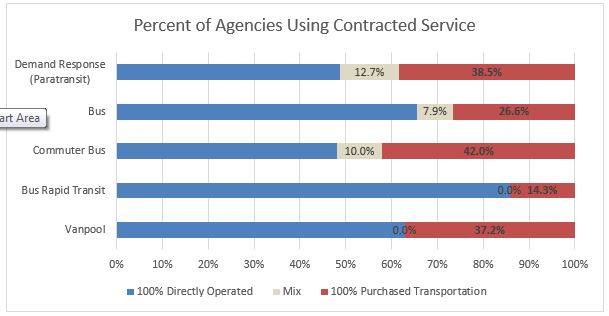
Another way to compare how much service is contracted or directly operated is to look at how many agencies are using each method. For some modes, we see a very different picture here. The biggest difference is in Demand Response service. While nearly 75% of service is contracted, only 51% of agencies contract any service at all. This difference comes about because the agencies that are contracting service are in general providing more service than those that directly operate service. The opposite is true of bus providers – those agencies that directly operate 100% of service are more likely to be larger agencies.
The chart below shows this relationship. The average agency that provides 100% of their demand response service as directly operated operates only 27,944 annual hours of service, compared to 137,159 hours of service on average for those agencies that contract out 100% of their demand response service. Agencies that directly operate 100% of bus service provide more service hours on average than those agencies that contract 100% of bus service, although the gap between the two is narrower for this mode.
| Average Service Hours – 100% Directly Operated | Average Service Hours –
100% Purchased Transportation |
Demand Response
(Paratransit) | 27,944 | 137,159 |
| Bus | 196,157 | 112,831 |
| Commuter Bus | 52,511 | 24,345 |
| Bus Rapid Transit | 91,533 | 57,906 |
| Vanpool | 64,537 | 71,588 |
Presumably, this difference comes about because of the strengths that agencies of different sizes have and where those agencies think they will find efficiencies in either contracting service or operating service themselves. Large agencies may find that they gain flexibility by contracting out demand response service to a variety of smaller operators. Smaller agencies may find that they gain experience and expertise if they contract out bus services to an outside company to run the service. Rapid agency growth may also lead an agency to contract some service.
Changes in Contracting Over Time
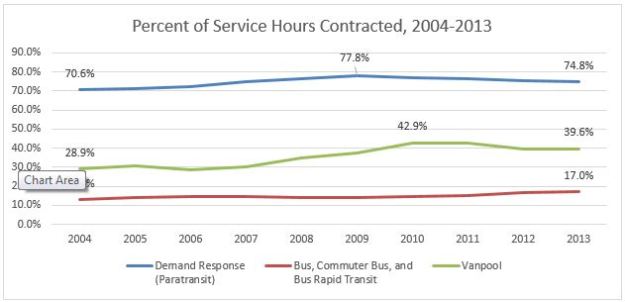
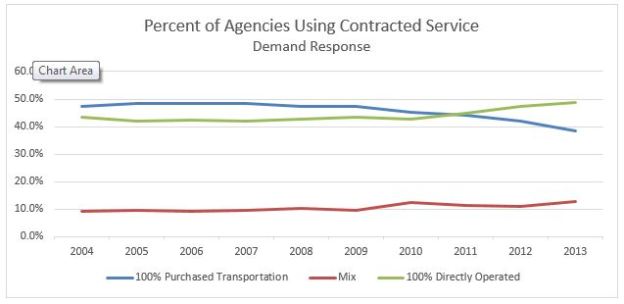
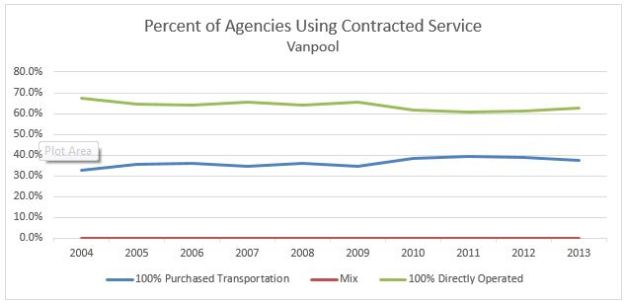
In general, a larger percentage of demand response, bus, and vanpool service is contracted than was contracted in 2004. For demand response and vanpool, the percentage of service contracted peaked around the recession (2009 for demand response, 2010 for vanpool) but has declined since then. It may be that during the increases in ridership up to the recession, agencies found that they could more flexibly increase service using contracted service.
Demand Response has shown an increase in the portion of agencies that are choosing to directly operate service or operate a mix of directly operated and contracted service. The percentage of agencies choosing to contract all of their demand response service has dropped.
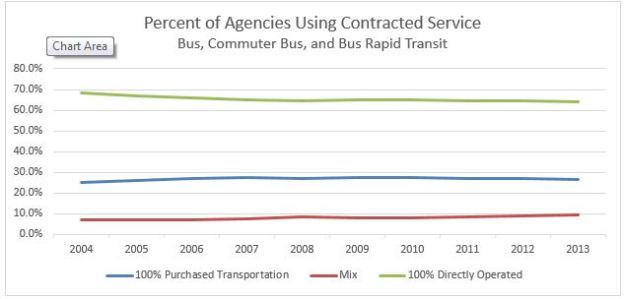
The percentage of bus agencies that are directly operating all of their service has dropped, while the percentage of agencies that are operating a mix of directly operated and contracted service increased. The portion of agencies only contracting service remained about the same.
The percentage of agencies contracting all their vanpool service rose just after the recession, but that percentage has dipped slightly. It’s possible that these services switch between contracts and directly operated service often.
Regional Differences
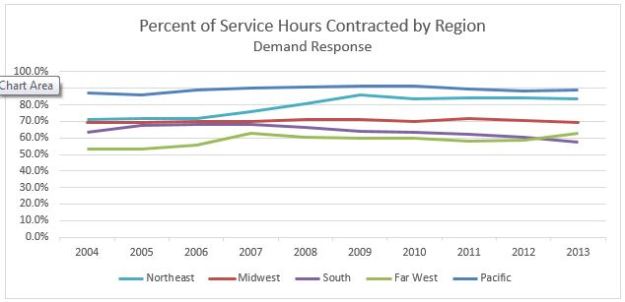
If we compare using the regions used in the APTA SU4T tool we can see some regional differences. A larger percentage of service in the Pacific region is contracted than in any other region. The Northeast, however, saw the largest increase in percentage of service contracted, from around 70% to over 83%. A lower percentage of service is contracted in the Far West region, though that has increased over this 10-year period.
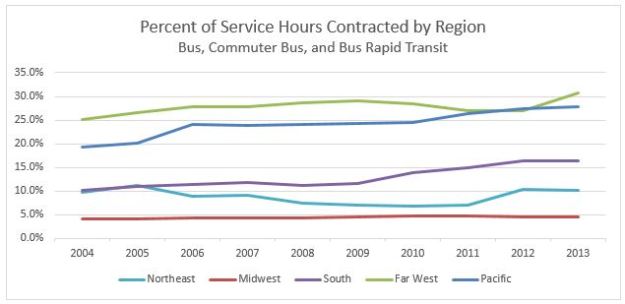
The picture is somewhat flipped when we look at bus service. More bus service in the Far West region is contracted than in any other region. The Pacific region still has a high level of contracted service. Less service is contracted in the northeast and Midwest regions, where agencies are more likely to have been around for many years. It is possible that the agencies in the Pacific and Far West regions are more recently established, and that may be the reason contracted service is more common.
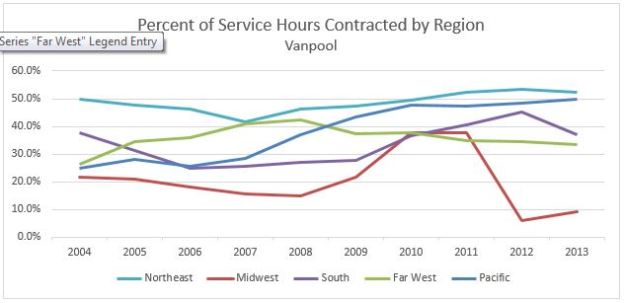
For vanpool service, most of the changes in the percentage of service contracted are due to additions of new vanpool providers to the National Transit Database. More vanpool service – over half – is contracted in the Northeast region. A small percentage of service is contracted in the Midwest region.
All these different arrangements are ways in which public transportation funding flows to the private sector and helps to create jobs beyond those they create in the public sector. These different arrangements of contracted and directly-operated service help each transit agency maximize the value of their public funding.
Acknowledgements:
The policy department would like to thank Cliff Henke, Chair of APTA’s Business Member Government Affairs Committee, for his assistance with this paper.
Like this:
Like Loading...
About the American Public Transportation Association
The American Public Transportation Association (APTA) is a nonprofit international association of 1,500 public and private sector organizations, engaged in the areas of bus, paratransit, light rail, commuter rail, subways, waterborne services, and intercity and high-speed passenger rail. This includes: transit systems; planning, design, construction, and finance firms; product and service providers; academic institutions; transit associations and state departments of transportation. APTA is the only association in North America that represents all modes of public transportation. APTA members serve the public interest by providing safe, efficient and economical transit services and products. More than 90 percent of the people using public transportation in the United States and Canada ride APTA member systems.
About Near Field Communication Technology
NFC technology makes life easier and more convenient for consumers around the world by making it simpler to make transactions, exchange digital content, and connect electronic devices with a touch. A standards-based connectivity technology, NFC harmonizes today’s diverse contactless technologies, enabling current and future solutions in areas such as access control, consumer electronics, health care, information collection and exchange, loyalty and coupons, payments, and transport. NFC technology is supported by the world’s leading communication device manufacturers, semiconductor producers, network operators, IT and services companies, and financial services organizations. NFC is compatible with hundreds of millions of contactless cards and readers already deployed worldwide.
About the NFC Forum
The NFC Forum (www.nfc-forum.org) was launched as a non-profit industry association in 2004 by leading mobile communications, semiconductor, and consumer electronics companies. The Forum’s mission is to advance the use of Near Field Communication technology by developing specifications, ensuring interoperability among devices and services, and educating the market about NFC technology. The Forum’s global member companies are currently developing specifications for a modular NFC device architecture, and protocols for interoperable data exchange and device-independent service delivery, device discovery, and device capability. The NFC Forum’s Sponsor members, which hold seats on the Board of Directors, include leading players in key industries around the world. The Sponsor members are: Apple Inc., Broadcom Corporation, Dai Nippon Printing Co. Ltd., Google, Inc., Intel, MasterCard Worldwide, NEC, Nokia, NXP Semiconductors, Qualcomm, Samsung, Sony Corporation, STMicroelectronics, and Visa Inc.
Follow the NFC Forum:
Facebook Google+ LinkedIn Twitter YouTube
###