Home > NewsRelease > DVR TIG Week: Meet Them Where They Are: Adjusting Data Visualization to Resonate with K–12 Evaluation Stakeholders by Rachel L. Schechter
Text
DVR TIG Week: Meet Them Where They Are: Adjusting Data Visualization to Resonate with K–12 Evaluation Stakeholders by Rachel L. Schechter
From:
American Evaluation Association (AEA) American Evaluation Association (AEA)
For Immediate Release:
Dateline: Washington, DC
Monday, November 12, 2018

 
Rachel Schechter
Rachel Schechter

My name is  Rachel Schechter, Director of Research at Lexia Learning Systems LLC, A Rosetta Stone company. At Lexia, our mission is to improve student literacy by leveraging technology to personalize learning and simplify the use of data to drive instruction. The research team at Lexia is committed to evaluating the efficacy and validity of our products, informing product design, partnering with customers to evaluate their implementations and student progress, and disseminating research findings and best practices.
A large part of my job is to develop dashboards and data visualizations to help communicate findings to evaluation stakeholders. In an effort to be more personalized in our reporting, I’ve been thinking a lot about the balance between scalability and customization – relying on templates vs. creating fresh content for each project or constituency.
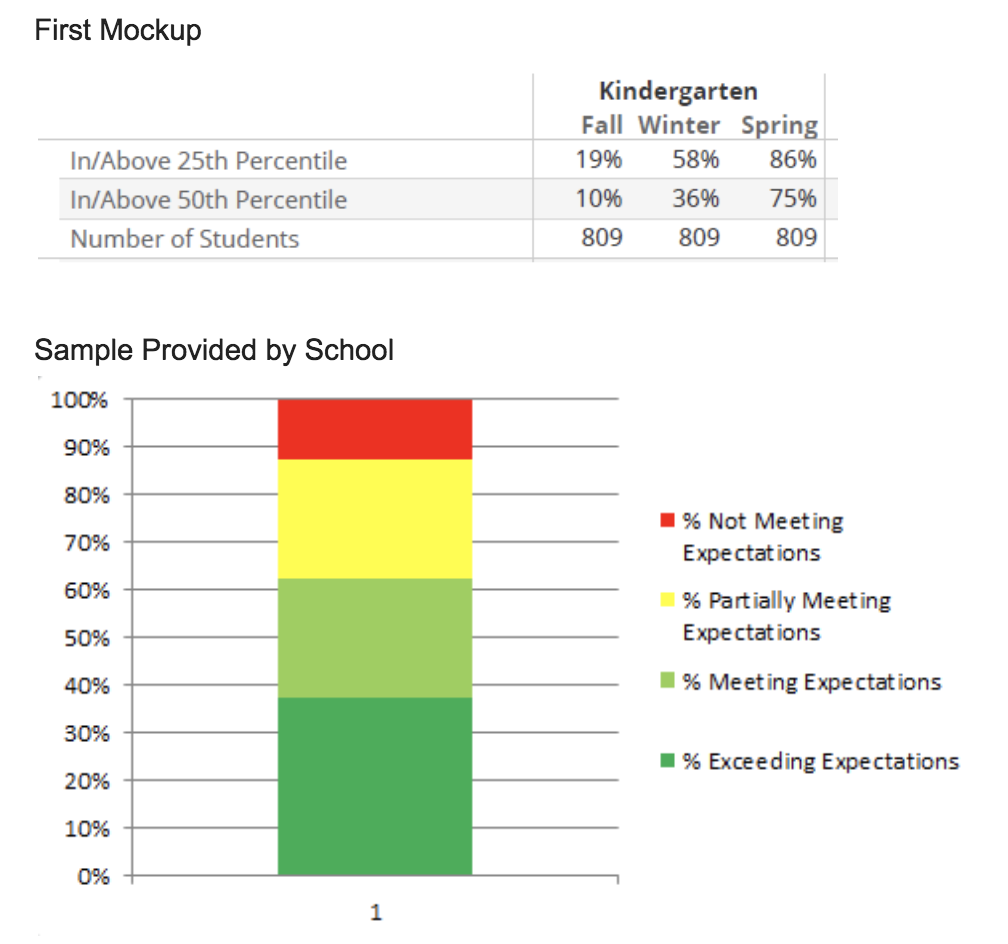
Recently, one of the largest school districts in the country requested custom reporting for Lexia® RAPIDTM Assessment, my company’s online literacy screener. The request came through internal Lexia staff working with the district. Initially, I was told that they “just need the basic info” organized into networks of schools. I took our existing templates and mocked up what seemed like a small adjustment.
The following week I presented samples to the district leaders, and they said that the graphs and tables didn’t look like the report designs that they were used to. I shifted quickly and turned their attention to characteristics like format, levels of summaries (grade, network, district, school) and graph type (stacked columns, bar) to better understand what resonated with them. Then I asked for samples of their commonly used reporting so I could pull design elements that were familiar.
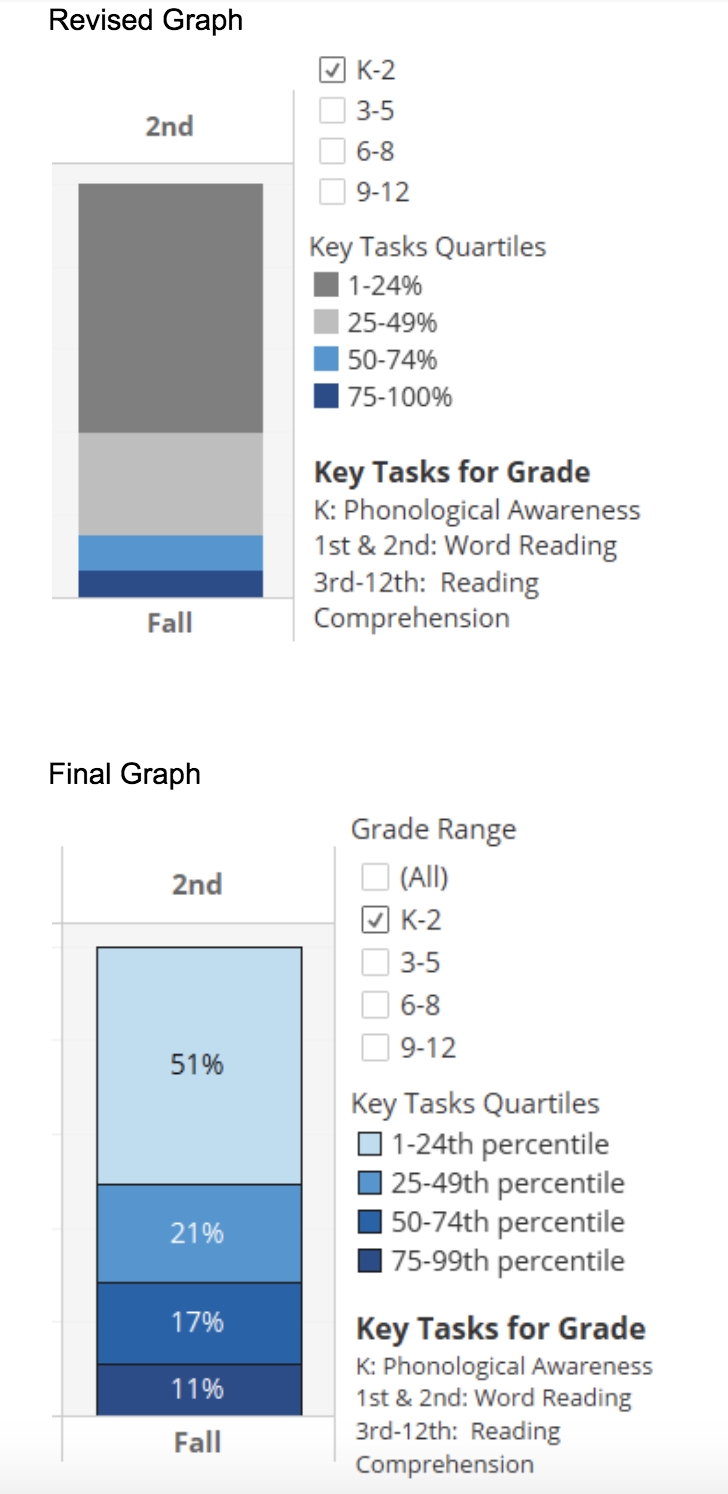
A few weeks later I presented the updated reporting to the district leader. She commented that she “saw her feedback” in the revisions and how “heard” she felt by our team. Success! She provided a final round of feedback related to color choice and ordering of groups – easy to adjust in time for the final report delivery. The training for all administrators is this week, and I feel confident that they will be able to use the information in the customized reporting to make instructional decisions at the network and school level — the whole point of assessment!
Lesson Learned:
No matter what you’ve heard from your colleagues or others involved in a relationship, always start with a needs assessment to start “from the beginning” with the evaluation end-user.  
Hot Tip:
Get samples from clients/customers of reports created by their internal team!  Using chart types and dashboard setups that stakeholders are familiar with will facilitate their understanding and support usefulness.
Pay attention to details, something as small as a color choice or the order of the items in a stacked bar chart bring meaning to the information. Check assumptions about those qualities along your design journey.
Note: Data in each image do not match, are not from a single district, and are not reflective of the district mentioned in the story.
First mockup of data and sample graph provided by schoolRevised graph and final graph
The American Evaluation Association is celebrating Data Visualization and Reporting (DVR) Week with our colleagues in the DVR Topical Interest Group. The contributions all this week to aea365 come from DVR TIG members. Do you have questions, concerns, kudos, or content to extend this aea365 contribution? Please add them in the comments section for this post on the aea365 webpage so that we may enrich our community of practice. Would you like to submit an aea365 Tip? Please send a note of interest to aea365@eval.org. aea365 is sponsored by the American Evaluation Association and provides a Tip-a-Day by and for evaluators.

About AEA

The American Evaluation Association is an international professional association and the largest in its field. Evaluation involves assessing the strengths and weaknesses of programs, policies, personnel, products and organizations to improve their effectiveness. AEA’s mission is to improve evaluation practices and methods worldwide, to increase evaluation use, promote evaluation as a profession and support the contribution of evaluation to the generation of theory and knowledge about effective human action. For more information about AEA, visit www.eval.org.

News Media Interview Contact
Name: Anisha Lewis
Title: Executive Director
Group: American Evaluation Association
Dateline: Washington, DC United States
Direct Phone: 202-367-1223.
Main Phone: 202.367.1166
Jump To American Evaluation Association (AEA) Jump To American Evaluation Association (AEA)
Contact Click to Contact
Other experts on these topics