Tuesday, March 28, 2017
My name is
Linda Stern, Director of Monitoring, Evaluation & Learning (MEL) at the National Democratic Institute. One challenge to evaluating democracy assistance programs is developing comparative metrics for change in political networks overtime. The dynamism within political networks and the fluidity of the political environments make traditional cause-and-effect frameworks and indicators superficial for capturing context-sensitive changes in network relationships and structures.
To address these limitations, my team and I began exploring social network analysis (SNA) with political coalitions that NDI supports overseas. Below we share two examples from Burkina Faso and South Korea.
 Lesson Learned #1: Map and measure the “Rich Get Richer” potential within political networks
 When supporting the development of political networks, donors often invest in the strongest civil society organization (CSO) to act as a “network hub” to quickly achieve project objectives (e.g., organize public awareness campaigns; lobby decision-makers). While this can be effective for short-term results, it may inadvertently undermine the long-term sustainability of a nascent political network.
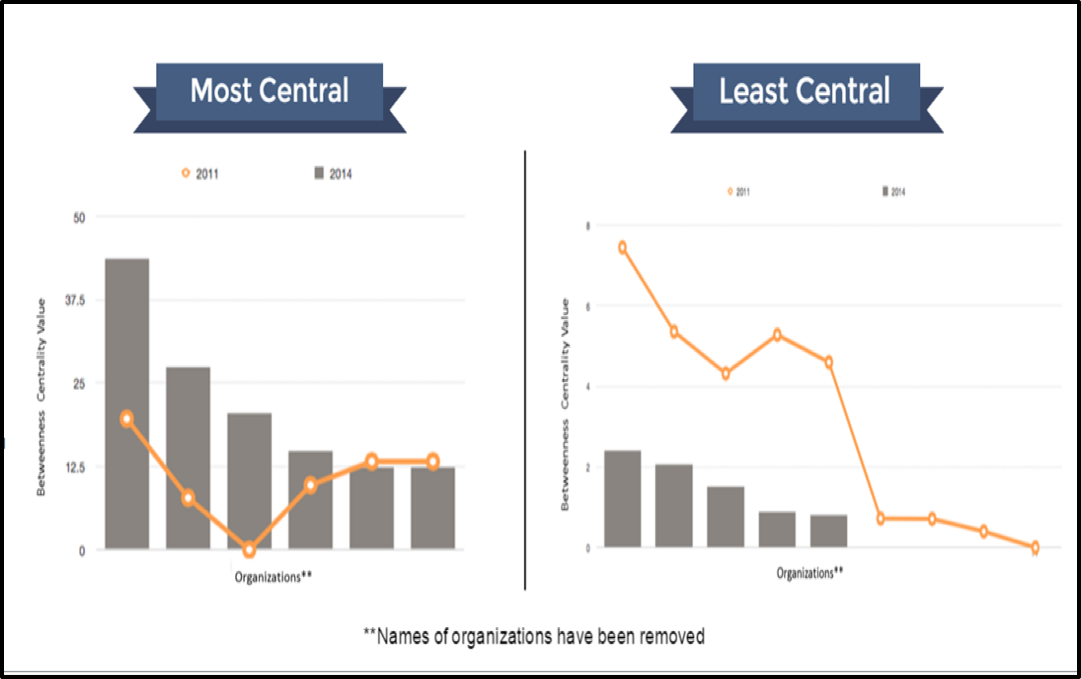
In evaluating the development of a women’s rights coalition in Burkina Faso, we compared the “
Betweenness Centrality” scores of members over time. Betweenness Centrality indicates the potential power and influence of a member by virtue of their connections and positions within the network structure. Comparative measures from 2012 to 2014 confirmed a “Power Law Distribution” in which the number of elite members with the highest “Betweenness Centrality” scores (read power and influence) within a network tends to shrink, while those with modest or little power and influence within a network tends to grow or be “distributed” across the network. This is known as the “Rich Get Richer” phenomenon within networks.
 Lesson Learned #2: – Use “Density” metrics to understand actual and potential connectivity within a changing network
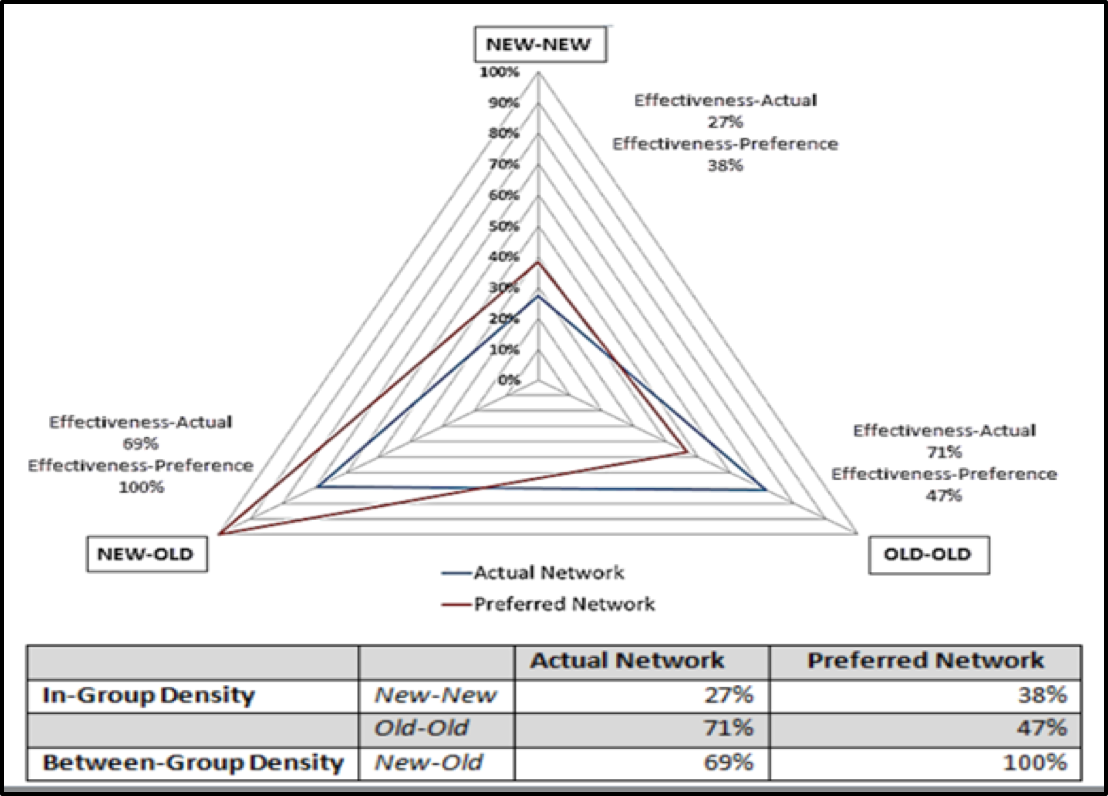
Understanding how a political network integrates new members is critical for evaluating network sustainability and effectiveness. However, changing membership makes panel studies challenging. In South Korea, to how founding and new organizations
preferred to collaborate, compared to how they were
actually collaborating, we used a spider web graph to plot the density of three kinds of linkages within the coalition: old-to-old; old-to-new; and new-to-new. As expected, the founding organizations were highly connected to each other, as measured by in-group “density” of 74 percent. In contrast, the new organizations were less connected to each other, with only a 27% in-group density score. We also found a relatively high in-group density (69%) of linkages between old and new members. When we asked members who they
preferred to work with, between-group density rose to 100%, indicating a strong commitment among founding members to collaborate with new members around advocacy, civic education and human rights initiatives. However, the overlapping graphs indicated this commitment had not yet been realized.
Rad Resource – After grappling with
UCINET software over the years, we finally landed on
NodeExcel, a free excel-based software program. While UCINET has more unique and complex features, for ease of managing and transformation of SNA data, we prefer NodeExcel.
The American Evaluation Association is celebrating Democracy & Governance TIG Week with our colleagues in the Democracy & Governance Topical Interest Group. The contributions all this week to aea365 come from our DG TIG members. Do you have questions, concerns, kudos, or content to extend this aea365 contribution? Please add them in the comments section for this post on the aea365 webpage so that we may enrich our community of practice. Would you like to submit an aea365 Tip? Please send a note of interest to aea365@eval.org. aea365 is sponsored by the American Evaluation Association and provides a Tip-a-Day by and for evaluators.