Wednesday, October 26, 2022
It’s conventional wisdom that personalization boosts the bottom-line performance of your email marketing. And it often works. But maybe don’t count on it…
That’s what we learned from this case study, which is the second of a series (here’s the first one) about a journey into personalized email that one of my clients took. You’ll learn what they did, how it performed, and what we learned.
As always, don’t just take these case study test results and apply them to your own program – do your own testing to see how your email subscribers respond to personalization.
Background
We had a huge success with our first test of personalization in email. While we were pretty confident that personalization was going to be our standard operating procedure, we decided to do another test to confirm this was the right direction to take our program.
Test Set-up
For our second personalization test, we started with an email message promoting UV phone sanitizers. These small devices could be purchased in bulk and personalized with a company logo. This is a popular holiday gift for customers and/or employees.
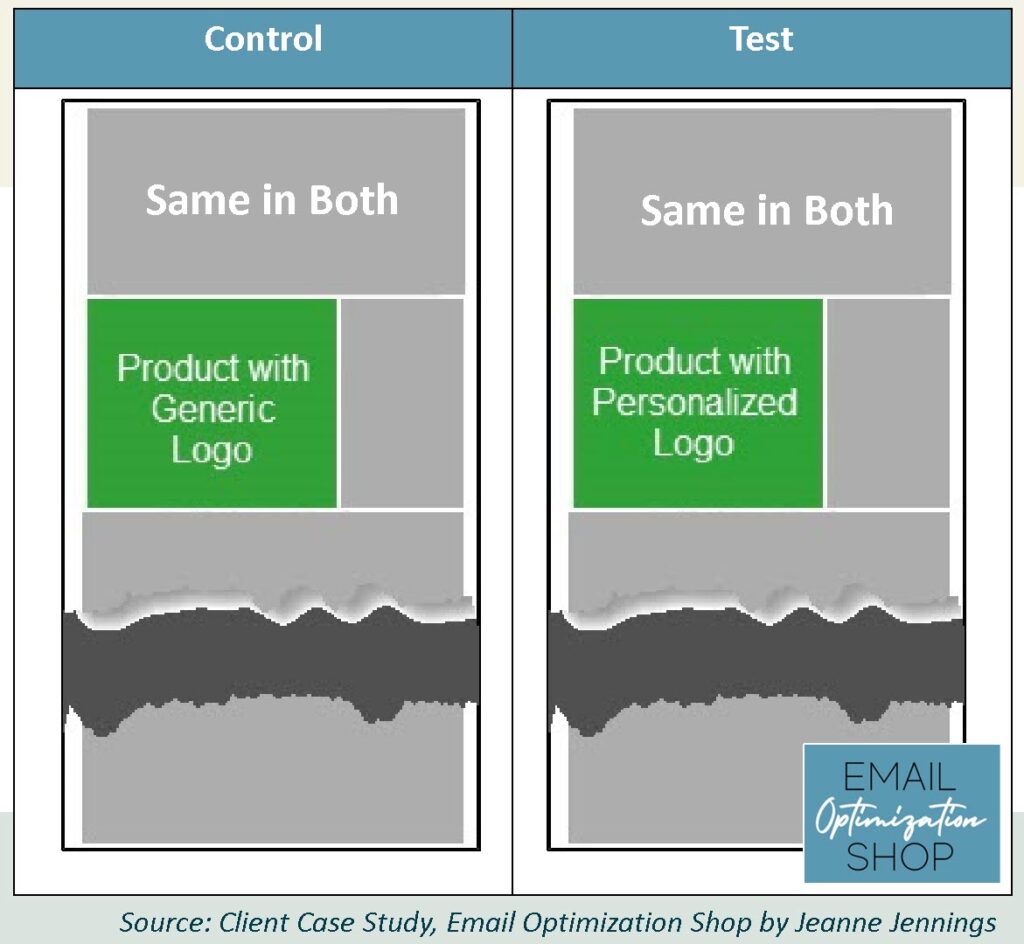
Our control is what we would usually send – it has an image of the product at the top; the product is imprinted with a generic company logo and has a ‘your company logo here’ starburst next to it.
For the test version, we were able to digitally add the recipient’s company logo in place of the generic company logo – which also allowed us to remove the starburst.
Wireframes of both versions appears below. The gray area was the same for both versions (I’ve truncated the wireframes to save space); the only difference was in the product image, which is green here.
We split the list randomly into two groups, one to receive the control and the other to receive the test. Each group had more than 225,000 email addresses in it. This is well above my minimum cell size of 20,000, which almost always allows me to get statistically significant results. See the split below.
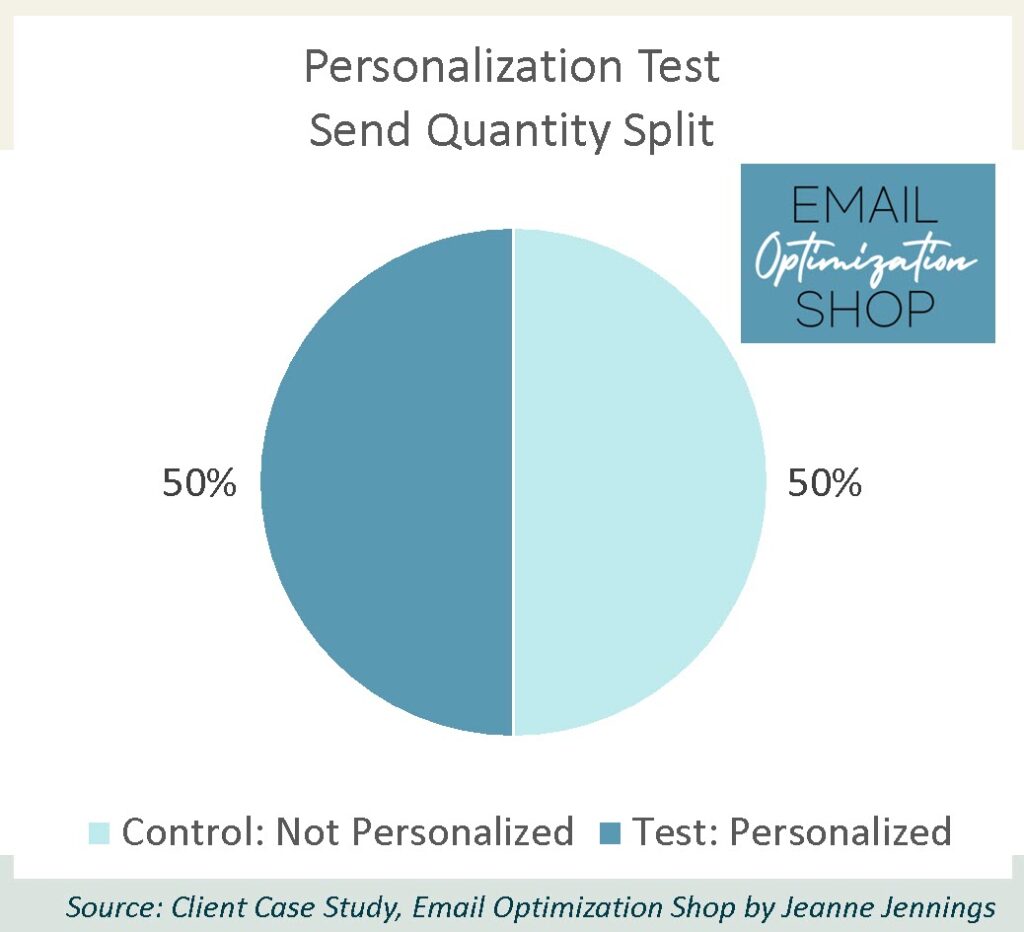
As you can see, 50% of the list received the test/personalized version, while the balance (50%) received the control/not personalized version.
As always, we kept everything except the personalization the same, so we could get clear results.
Which version do you think won? Was it the test with the personalization? Or the control without the personalization?
I’ll give you a minute to think about it… then scroll down to get the answer.

Results
Here are the results!
That’s right. The personalized test version lagged the control significantly.
How many of you guessed correctly?
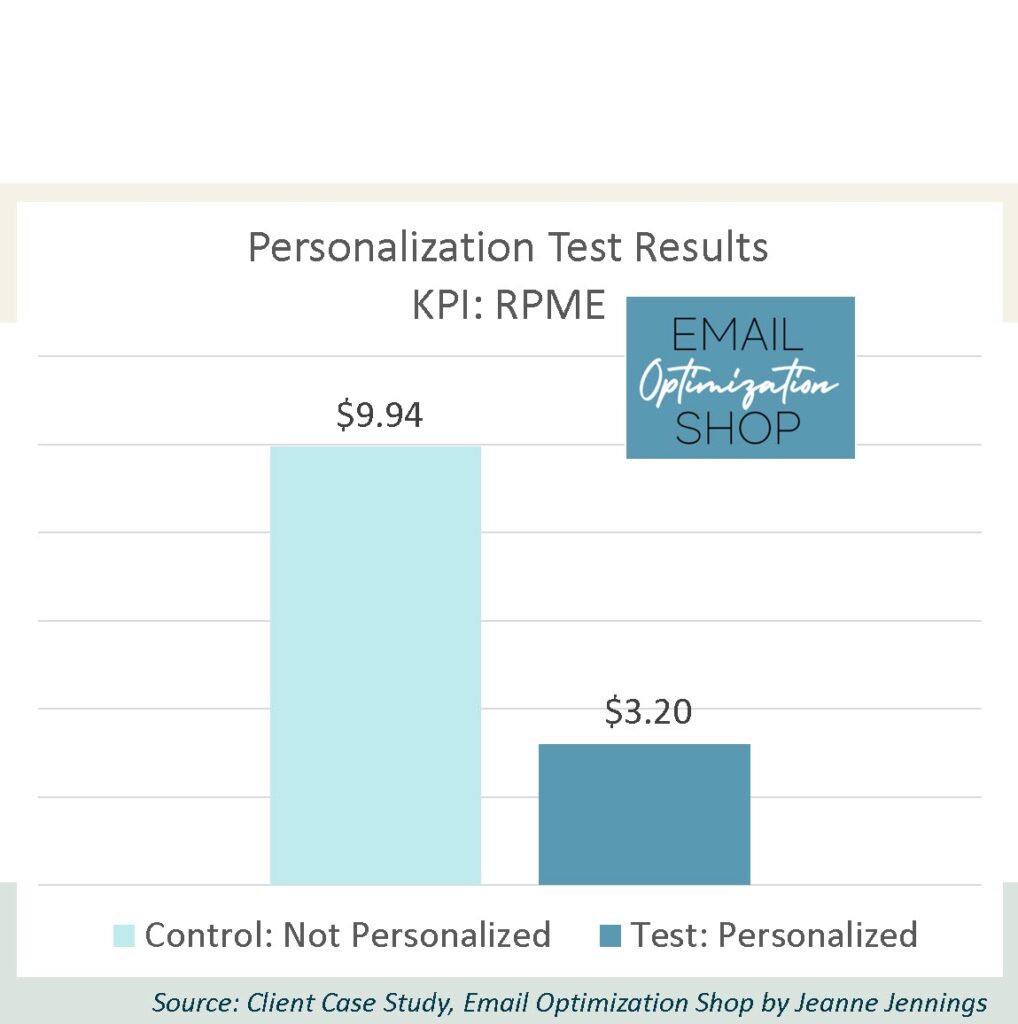
Our key performance indicator (KPI) here is revenue-per-thousand-emails-sent (RPME), because we are looking to optimize revenue.
Note: We used RPME instead of revenue-per-email (RPE) because the RPE numbers were small. By increasing the magnitude it makes it easier to see variances – and the relative variance between the cells remains the same.
Here are the full results.
As you can see, the personalized test version generated only a third the RPME that the not personalized control version did. Just over $3 compared to nearly $10 RPME is a dramatic difference. What kind of pain would be feeling if we had shifted to personalizing the logo without testing it?
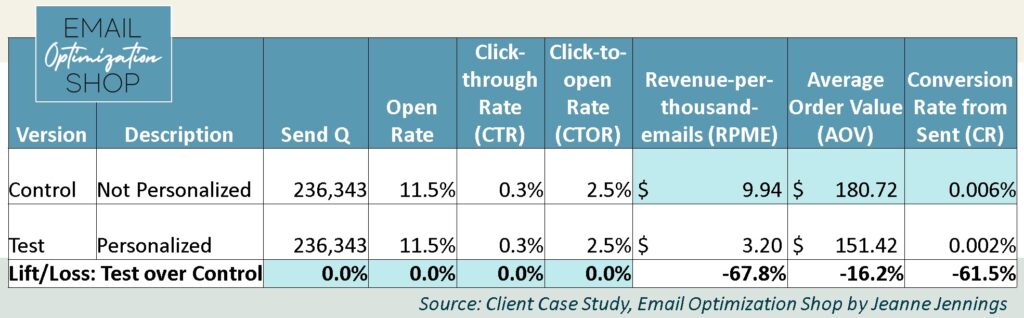
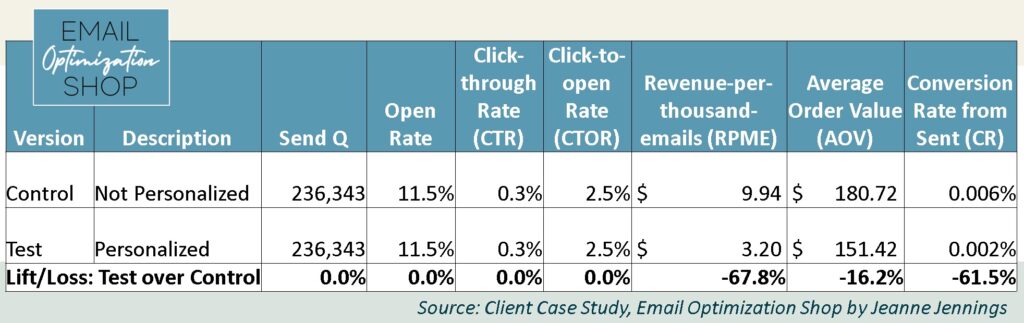
Going deeper, we see that the test and control versions showed no differences in open rate, click-through rate (CTR), or click-to-open rate (CTOR). They were each exactly the same when we rounded them to a single decimal point. More proof that CTR is not a good key performance indicator (KPI).
The reason the test version failed is primarily because it lagged the control in conversion rate (CR). The test drove 64% fewer orders than the control did. Note that conversion rate is calculated from the non-bounce send quantity, not from clicks.
There was also a slight loss, roughly 16%, in average order value (AOV) for the personalized version.
Were we surprised by the result?
Yes. We were shocked. And saddened. We had such high hopes for personalization after the results of the first test. We had anticipated that personalizing the product logo would boost performance as much or more than personalization organization name.
Take-aways
So, does this mean that you should not personalize your email messages?
No.
In our post-mortem on this test, we had some thoughts about why it failed.
We believe that the space allotted for a logo had something to do with it. The space was (a) small overall and (b) much wider than it was tall. Because it was a relatively small space, complicated or large logos didn’t look good. In fact, some of those that we looked at after the fact looked like screen smudges.
The same was true for logos that were more tall than wide. They didn’t look like logos, as it was a small space on a larger product in a much larger email.
It’s important to hypothesize about what might have impacted your results, win or lose. Doing this after a losing test is almost more important, as you are often able to adjust your approach and win on your next test.
Which is what we did on our next personalization test. Watch this blog for details…
In the meantime, give it a shot and let me know how it goes! Better yet, call me if you’d like some help with your email marketing A/B split testing…
Be safe, stay well,